Running Qwen3.8 Flash Next on an M5 Max, and the fight with prefill
Running a 125B MoE model on one Mac as an agent backend. I assumed the model was slow. A day of digging showed the real culprit was prefill — and how caching and a few flags fixed it.
I wanted to see whether a single Mac could run a local LLM well enough to actually use. I loaded Qwen3.8 Flash Next in 4bit onto a 128GB M5 Max, wired it up as an agent backend, and gave it real work all day.
It was frustrating at first. Once a conversation got long, a single turn took minutes. I assumed that was simply what the model does — then I read the logs. It was not. The culprit was prefill.
What I loaded
- Model: Qwen3.8 Flash Next, 125B total with 6B active MoE, 4bit. 48 layers mixing GDN and full attention, plus an MTP head. Resident memory around 64–70GB.
- Server: mlx-serve 26.8.11. Native Apple Silicon, no Python required, accepts OpenAI/Anthropic APIs directly.
- Hardware: M5 Max, 128GB. Context set to 131,072.
Decode was better than expected
Token generation speed first.
| Context | decode |
|---|---|
| 0–20K | 75–91 tok/s |
| 40–60K | 68 tok/s |
| 60–80K | 58 tok/s |
| 80–100K | 57 tok/s |
Decode is a memory-bandwidth fight. Every token means sweeping the active weights, and a Mac with generous unified memory bandwidth turns out to be good at this. Being MoE — touching 6B of 125B — helps a lot too. It slows as context grows, unavoidably, but this is usable.
The problem was elsewhere.
The slow part was prefill
Prefill is the stage that reads the whole prompt at once to fill the KV cache. Unlike decode, raw compute is the bottleneck, and that is where a Mac is weak.
A cloud GPU chews through 100K tokens in 5–15 seconds. The same work took this Mac 3–4 minutes on a cold calculation, because throughput was only 130–500 tok/s.
So I changed direction. There is no way to make prefill fast. There is a way to avoid doing it twice. That is what the whole day turned into.
Fixing the cache first
An agent sends the same prompt prefix every turn — system prompt plus tool definitions — with only the tail growing. If mlx-serve holds the KV for that prefix in cache (RAM + SSD) and reuses it, the next turn only has to compute what was added.
There is a condition: if a single byte of the prefix changes, everything after it is recomputed. In my case a bug made the tool definitions shift slightly each turn, so only 24K of 84K (29 percent) was being reused and the other 60,000 tokens were recomputed every time.
After fixing the cause:
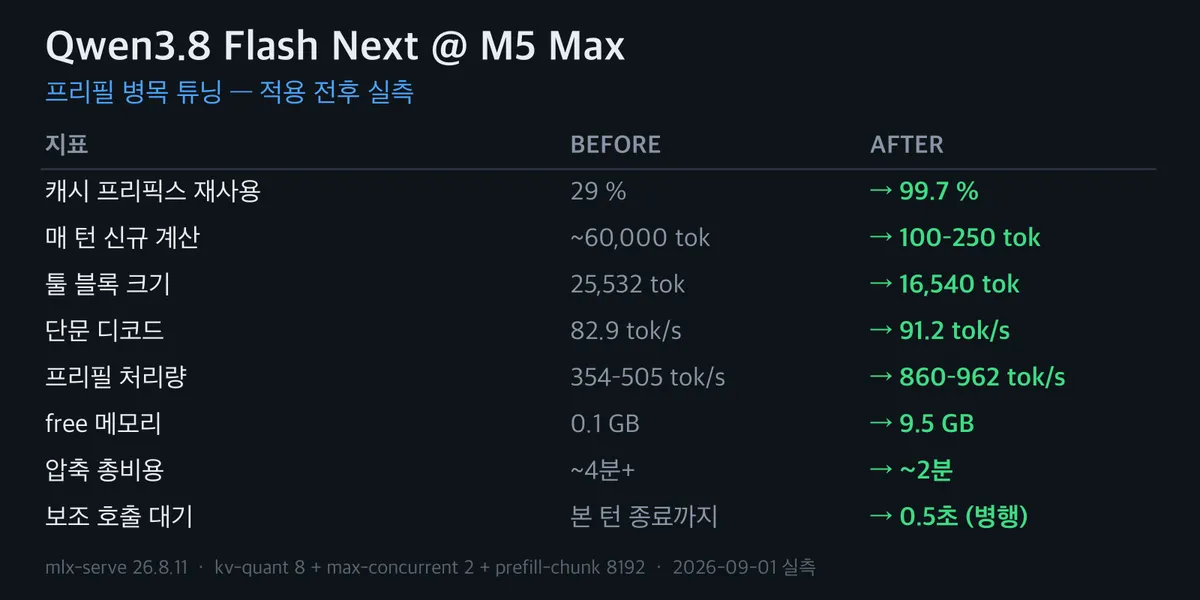
cache reuse       29%  →  99.7%
new tokens/turn   60,000  →  100–250
Turns that had taken four minutes at the same point became a few hundred tokens of computation.
One flag worth calling out: do not leave --prefix-cache-entries at 1. At 1, a single small request
evicts your main conversation from the cache. At 2 or more it holds both.
I also trimmed the tool list
Tool definitions ship in full with every request. Looking at five weeks of logs, plenty of tools had been registered and never once called. I turned the unused ones off.
tool definitions 25,532 tokens → 16,540 tokensA shorter prefix means the prompt has to grow further before compaction triggers, so compaction happens less often too.
Three server flags
I adjusted mlx-serve options.
--kv-quant 8— stores the KV cache at 8bit. Halves what decode has to read, so long contexts speed up, and cache entries shrink by half, which frees memory.--max-concurrent 2— processes requests concurrently. The small side requests an agent throws in (summaries, vision checks) no longer queue behind the main job.--prefill-chunk 8192— MoE re-reads expert weights at every prefill chunk boundary. Larger chunks mean fewer of those.
After enabling them:
short decode       82.9   →  91.2 tok/s
free memory        0.1GB  →  9.5GB
compaction total   4min+  →  2min
side-request wait  until the main turn ends  →  0.5s
prefill throughput 354–505  →  860–962 tok/s
For conversation compaction, the summarization itself is cheaper than the recomputation that follows it. Doubling prefill throughput halved that too.
It wedged twice
Running overnight, the server stopped twice. State reported ready, but it could not process any
request. Logs showed only <- 0+0 tokens and CPU sat near zero. Both times the cache had swollen to
around 15GB.
I first assumed lowering the memory cap (--prefix-cache-mem) would fix it. It did not — if a
currently-active entry is larger than the cap, there is nothing evictable. What worked was halving
--ctx-size, which stops cache entries from getting that large in the first place.
The benchmark is still running
Separately from speed, I am measuring whether the model actually completes agent tasks, using Terminal-Bench 2.1 (89 tasks). Not finished — these are partial results.
- Pilot of 5: 5 passed
- Overnight partial run of 22: 13 passed / 9 failed, 59 percent
That is about a quarter of the 89, so it is not a final score. One pattern stood out anyway.
passed, average  8.3 min
failed, average  27.4 min
What it solves quickly, it passes. What it grinds on, it generally fails. If it grasps the problem it finishes fast; if not, it wanders and burns time. Failures clustered in build/compile work and cryptographic or numerical algorithms. I will write up the full 89 separately once it finishes.
None of this is free
Everything above amounts to “do not prefill twice,” and that has a price. Worth writing down so I remember why it is set up this way.
It spends memory instead. Reuse means holding the KV somewhere. Free memory dropped from 76GB to 0.1GB, and a single conversation consumed 12–15GB of cache. The compute burden moved to memory, so the bigger the cache the faster it gets — and the closer to the wedge above.
The prompt prefix becomes untouchable. Since the cache hinges on prefix equality, putting a clock in the system prompt or swapping a tool mid-conversation throws it away. Conversation compaction is the worst case: summarizing rewrites the tail and invalidates the cache wholesale. Going fast means freezing the front, and that is flexibility you give up.
It does nothing for new work. The cache only pays when the same prefix repeats. A first turn, or any long prompt seen for the first time, gets computed in full. The benefit is real in conversations and agent loops, and absent in one-shot long jobs.
kv-quant is lossy. 8bit is imperceptible in normal use, but it does requantize the KV, so precise
numerical or cryptographic work can come out wrong. If something looks off, start by trying
--kv-quant off.
| Gained | Paid |
|---|---|
| No prefill | memory pressure, wedge risk |
| A few hundred tokens per turn | frozen prefix, less flexibility |
| Half-size cache | kv-quant loss |
| Fast repeated conversations | no effect on new work |
Summary
This is how I run it now.
mlx-serve serve --host 127.0.0.1 --port 11234 --mtp \
  --ctx-size 131072 --prefill-chunk 8192 \
  --kv-quant 8 --max-concurrent 2 \
  --prefix-cache-entries 2 --prefix-cache-mem 8GB --prefix-cache-disk 60GB
Do include --host 127.0.0.1. The default is 0.0.0.0, which exposes it to your local network.
Making a local LLM usable on a Mac turned out to be less about the model than about how you avoid prefill. In order of effect: cache reuse (29 → 99.7 percent) mattered most, then shrinking the prompt, then kv-quant. Decode needed nothing — Macs are already good at it. But the moment compaction triggers, or a tool changes, or a new long prompt arrives, you pay the full prefill price again.
(As of 2026-09-01. Numbers vary with workload and load.)