[monitoring] When "last updated at" is the wrong thing to alert on
If you alert on a value that does not change while things are working, it will fire eventually — guaranteed. The metric that produced false alarms, and the real alert we silenced while fixing it.
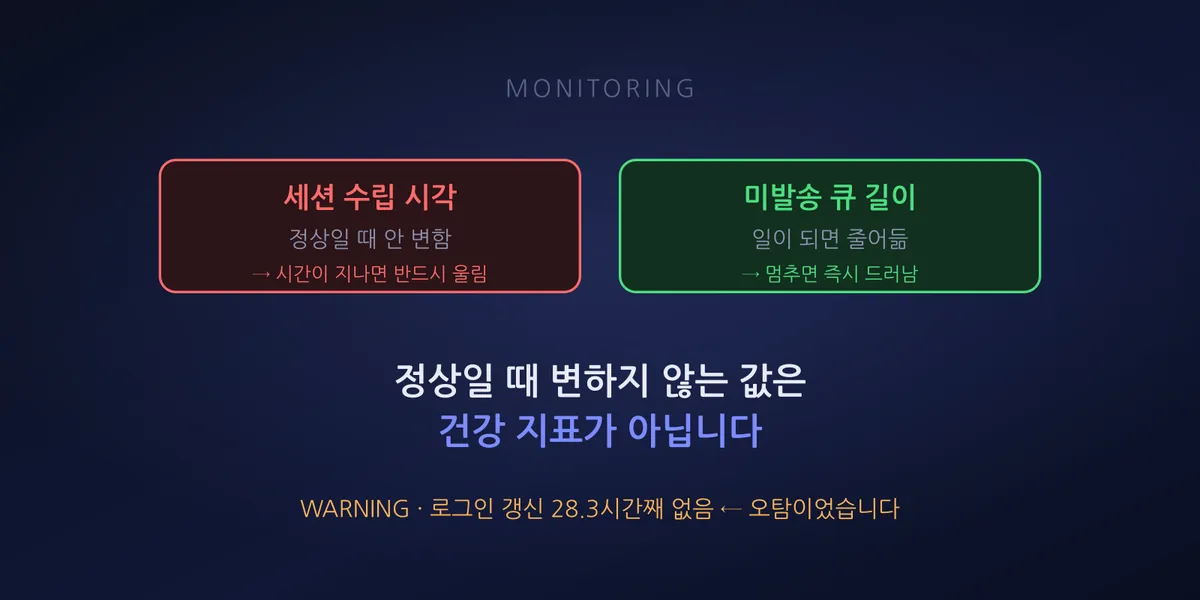
An alert came in.
WARNING · no login refresh for 28.3 hoursIt meant the SMS-sending agent had not logged in to an external system for over 28 hours. It looked like the session had dropped.
Everything was fine.
| Check | Value |
|---|---|
| Unsent queue | 0 |
| Yesterday’s volume | 51 → 96 (45 more sent) |
| Most recent send | minutes ago |
| Agent status | healthy, systemd active |
Messages were still going out. The alert was wrong.
That value is not supposed to change
The problem was the metric I picked.
The agent writes a LoginTime into a state file, and that is the moment the session was first
established. It does not refresh while the session stays up. If it logged in a day ago and has
been working fine ever since, that value being a day old is correct.
I had put a 26-hour threshold on it. Which means the longer the session stayed healthy, the more certain the alert was to fire. I had built a check that flags the healthy state as a fault.
There are more values like this than you would think.
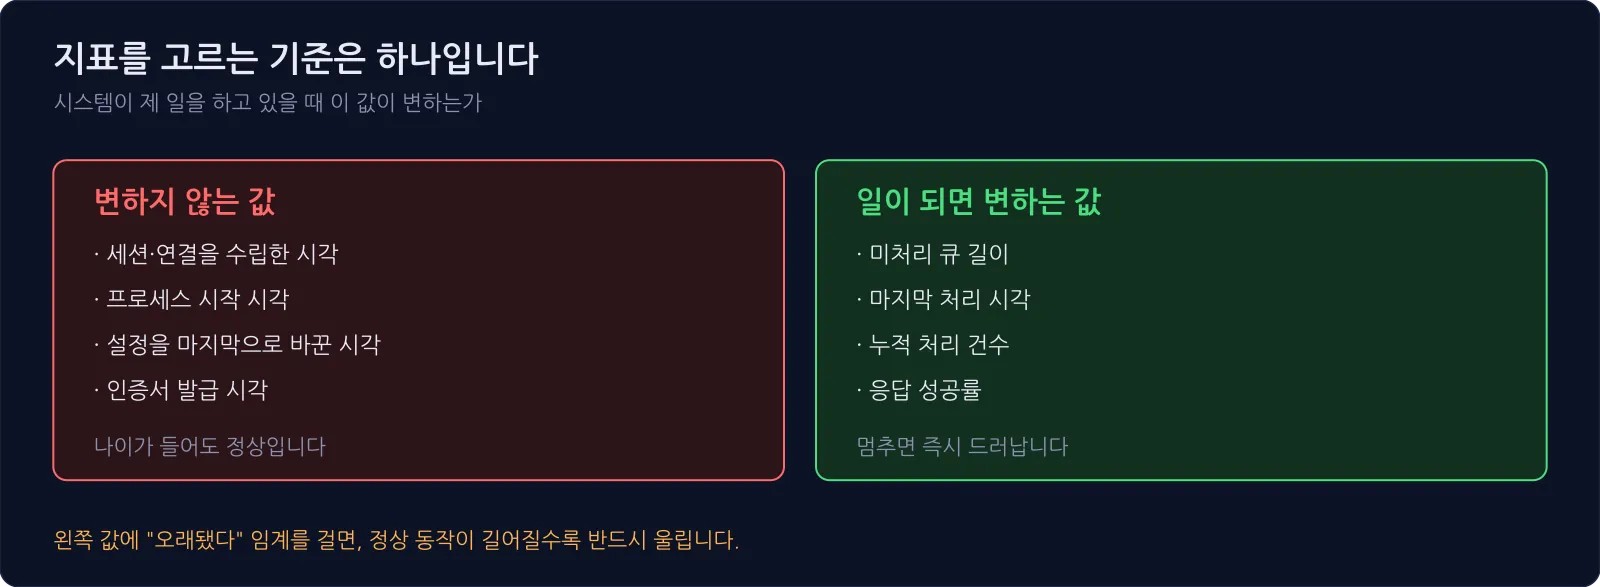
- When a session or connection was established
- When a process started
- When configuration was last changed
- When a certificate was issued
They all look like they tell you whether something happened recently. But they do not move while the system is working. An old value may simply mean nothing has gone wrong.
Pick metrics by asking whether they move when healthy
There is one question worth asking when designing an alert.
Does this value change while the system is doing its job?
If not, its age is not a health signal. In this agent there was a value that genuinely kept moving: the time of the last message sent. If sending stops, that value ages. That is the real signal.
So we changed the metrics.
| Item | Before | After |
|---|---|---|
| Session established at | alert past 26h | alert removed, shown as info only |
| Last message sent at | none | alert past 48h |
| Unsent queue | none | alert on backlog (primary metric) |
| Process / runtime status | present | kept |
Moving the primary signal to the unsent queue was the biggest change. In a message-sending system it is the number that most directly answers “is work happening.” A growing queue is a problem regardless of cause, and an empty queue generally means things are fine.
The same approach transfers. When watching for a disk filling up, measuring what is filling it catches the problem far earlier than watching utilization. That case is written up in pg_wal that will not shrink — start with replication slots.
Fixing a false alarm silenced a real one
It would have been nice to stop there. Around the same time I made the opposite mistake.
A different check script was alerting on stopped servers as “connection failed.” We were decommissioning machines, so the number of stopped hosts kept growing and it fired constantly. I added a filter: pull the list of running guests from the virtualization API and skip anything not on it.
The logic was right. The name matching was not.
- One physical server is not in the virtualization list at all. It got excluded as “stopped”
- Two database nodes had display names that differed from their actual guest names. Also excluded
That dropped an entire three-node database cluster from the checks. And at that moment the cluster actually had a problem. The filter swallowed the target, a CRITICAL quietly disappeared, and the check result turned green.
No alert arrived, so nothing looked wrong. This is the most dangerous failure mode in monitoring. False alarms are noisy, so they get fixed. A real alert eaten by a filter makes no sound at all.
The fix was structural: keep the display name and the actual guest name as separate fields, and treat a host with no virtualization guest name as physical — always checked.
When you add a filter, print what it excluded
The rule that came out of these two incidents is simple.
If you add an exclusion, log what got excluded and look at it at least once. Not “we checked N hosts” but “here is what we did not check.” Printing the exclusion list is how we found the physical server and the database nodes missing.
And when you add or change a check, make it fire on purpose once. Lower the threshold, confirm an alert actually appears, then restore it. That is what separates “zero alerts because everything is fine” from “zero alerts because the check is silently broken.”
Summary
- The age of a value that does not change while healthy is not a health metric. Session start time and process start time are the classic examples
- Make the primary signal the number that most directly answers “is work happening.” Queue depth, time of last processed item
- Exclusion filters should print what they excluded. An alert a filter swallows makes no sound
- Fire every new check once on purpose, then restore it
When alerts fire often, people start ignoring them. Reducing false positives is not really about accuracy — it is about protecting the credibility of the whole alerting system. But narrowing conditions to get there can just as easily cut away the real signal. The two mistakes look opposite; they share a root cause. Not checking what the metric actually means.